From Ad Click to Closed Deal on One Screen: An AI Marketing ROI Dashboard
Trace every lead from its source to the closed deal, compare cost per lead with cost per won deal, and get a weekly AI summary your leadership will actually read. Works alongside Sales Intelligence and BI Builder.
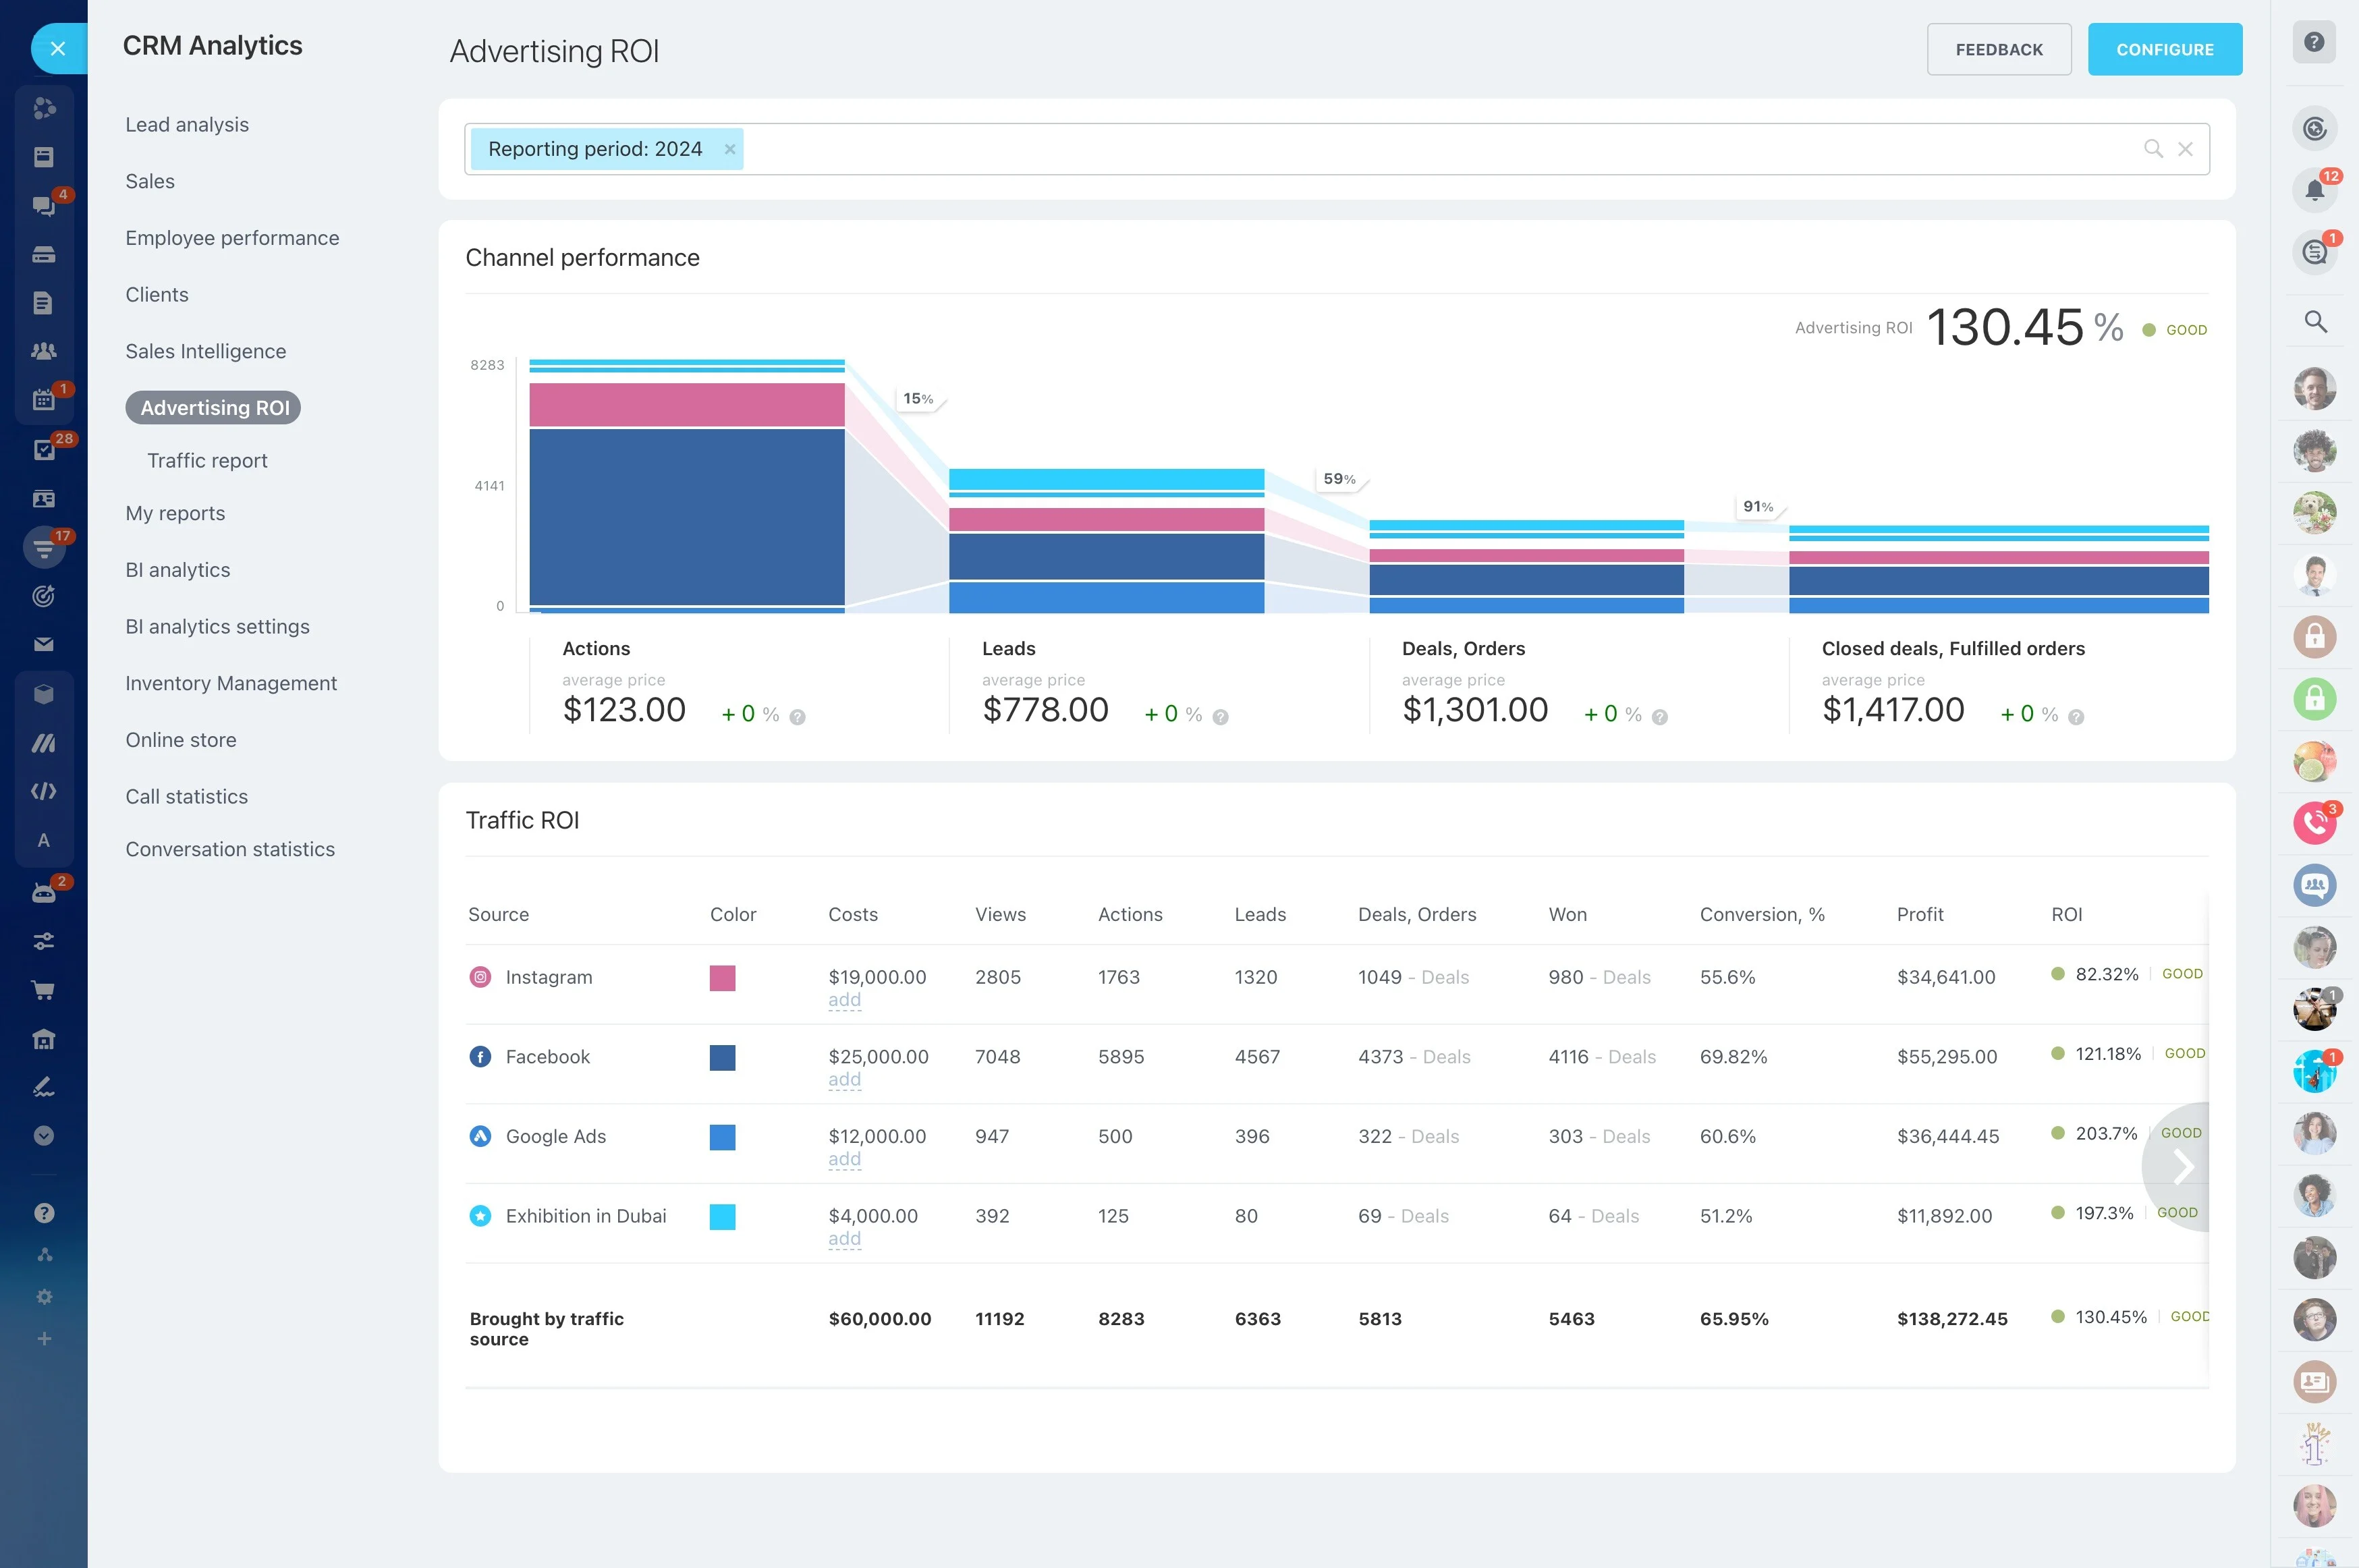
Counting leads is easy; proving which campaigns brought revenue is not. Bitrix24 Sales Intelligence and BI Builder already cover deep analysis, and with Alaio Vibecode you can add a focused ROI view with weekly AI commentary for your team.
- Connect lead sources and UTM data to won deals.
- Compare cost per lead with cost per closed deal.
- Get a weekly AI summary of campaign performance.
- Share one clear view with leadership.
When to Use BI Builder Instead
Both tools work from the same CRM data and serve different jobs.
- Use BI Builder for open-ended, multi-dimensional analysis.
- Use the dashboard for a fixed set of weekly KPIs.
- Combine them for routine reporting and deeper investigations.
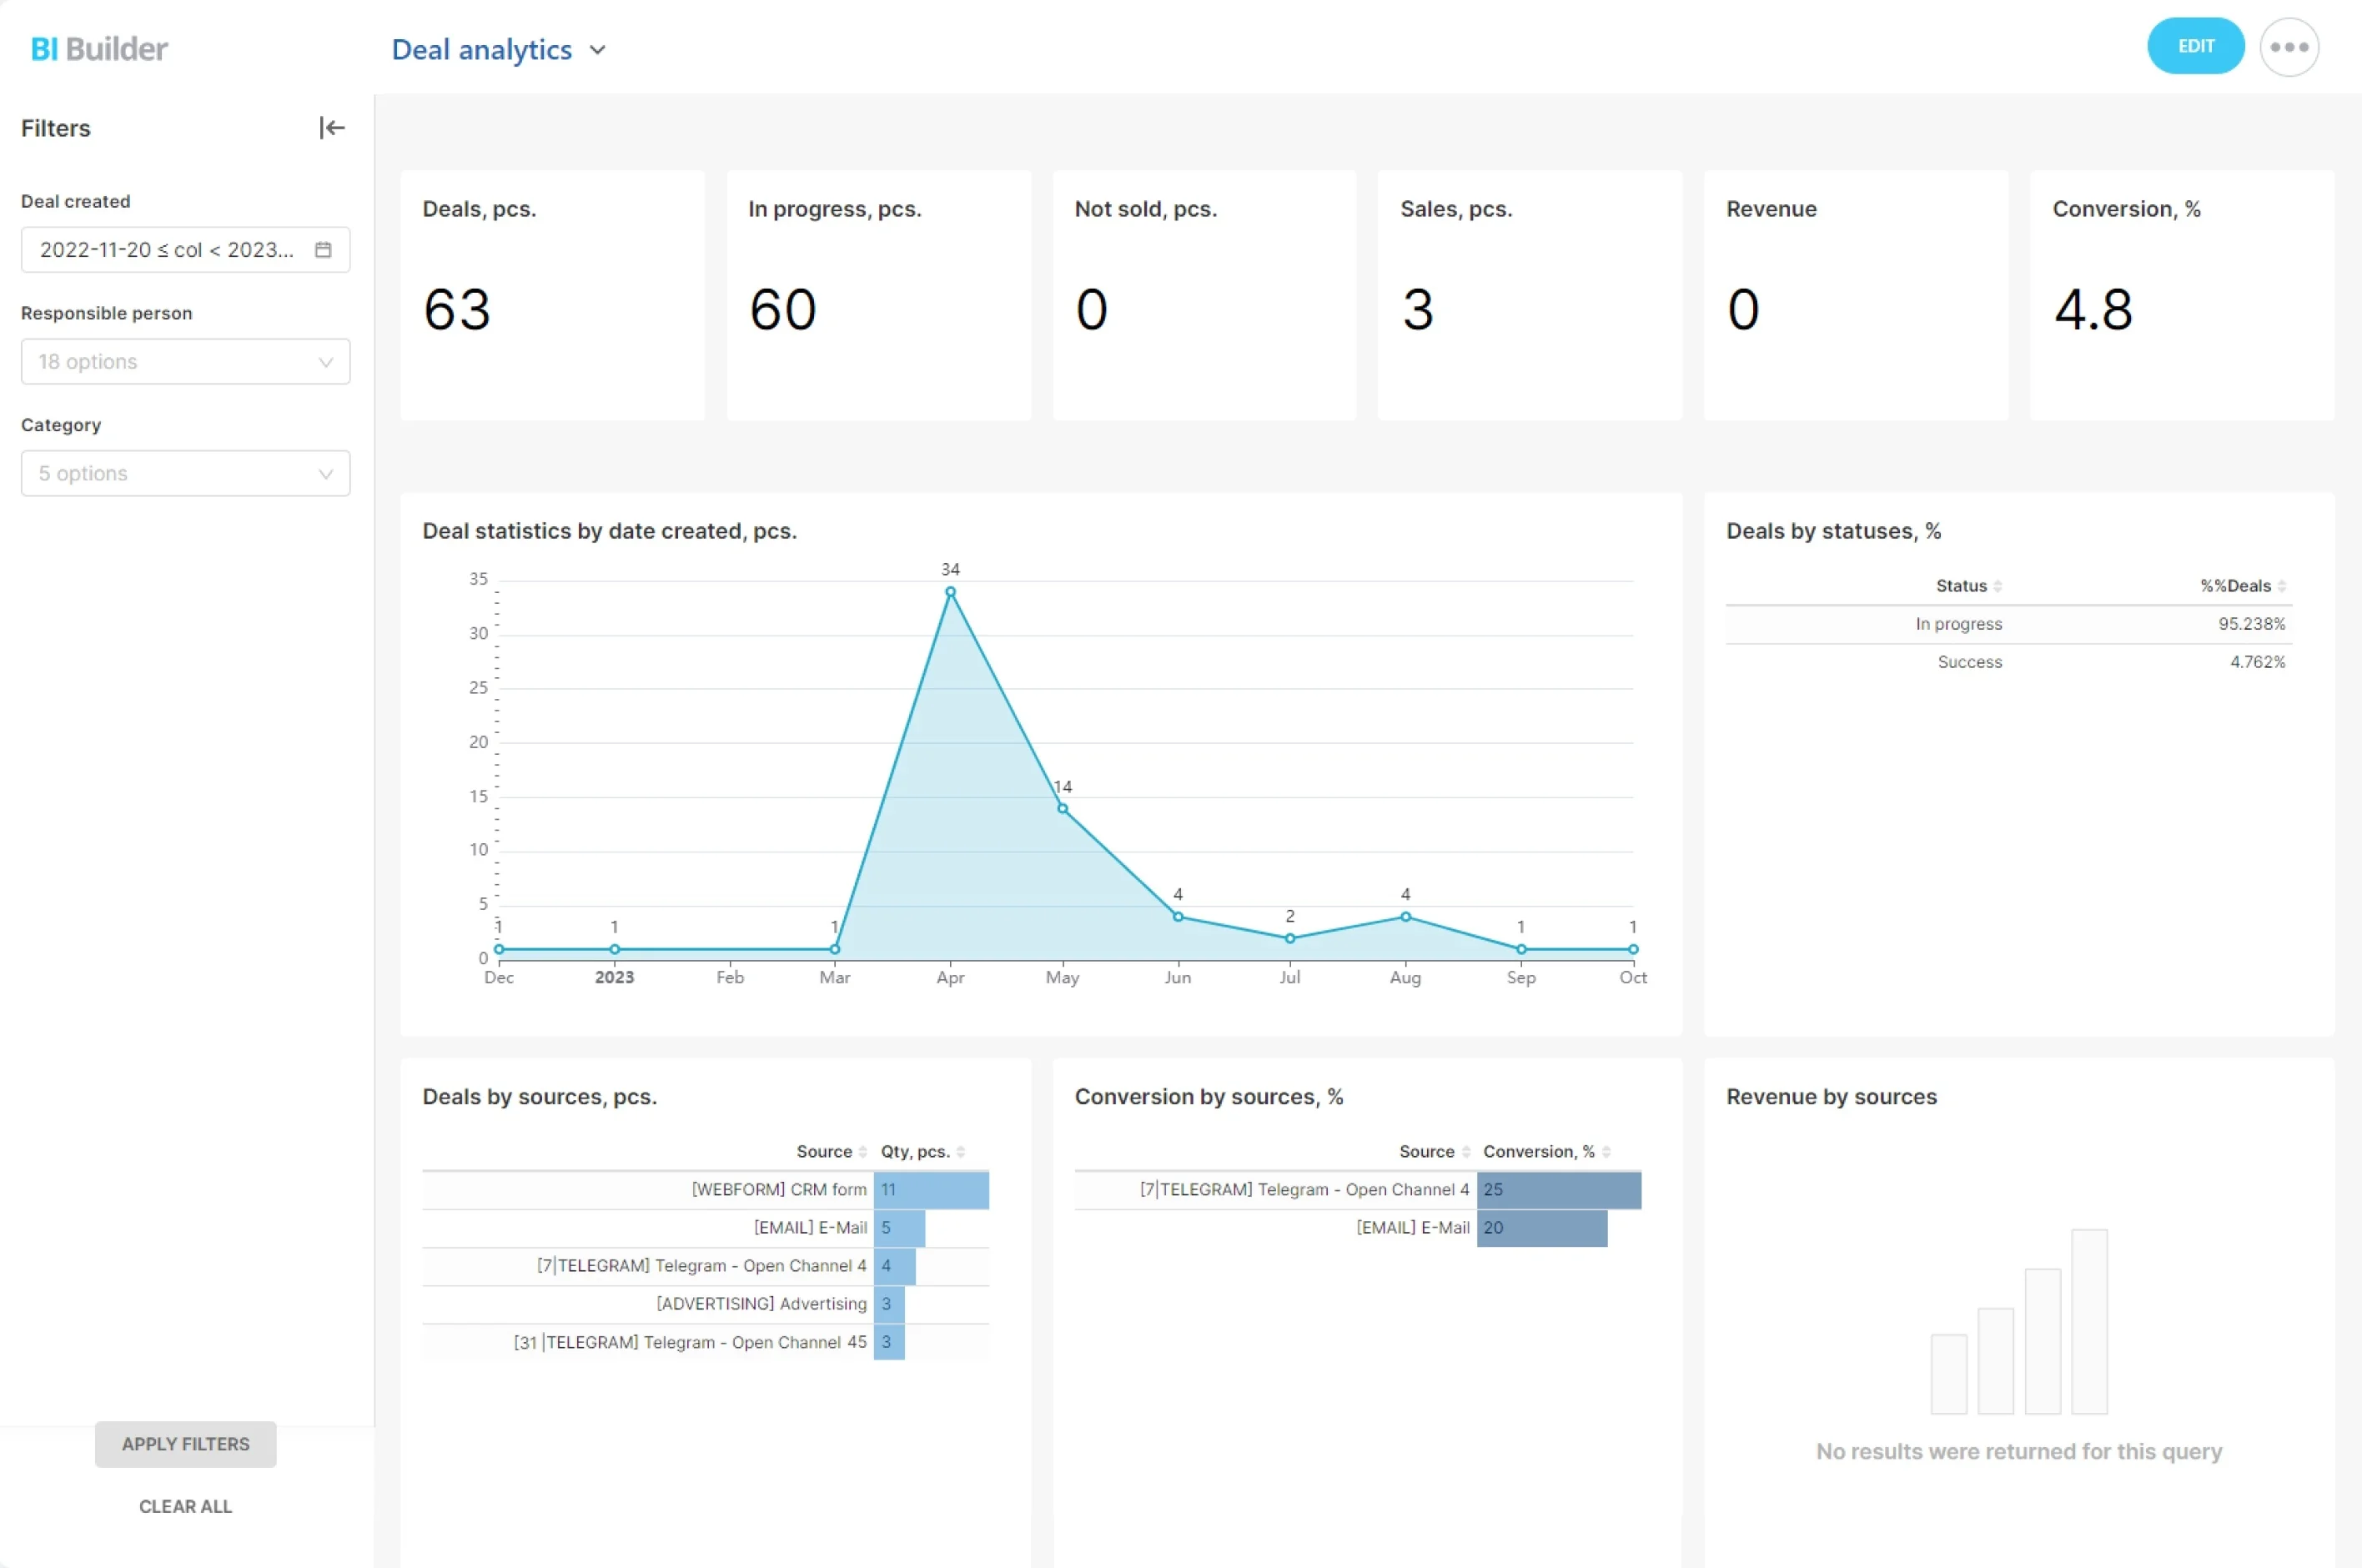
Lead Source to Revenue, End to End
The dashboard follows each lead from its source to the final deal.
- Calculate conversion and revenue in code from CRM records.
- Attribute revenue to the original source, even with long cycles.
- Drill down from a channel to the deals behind it.
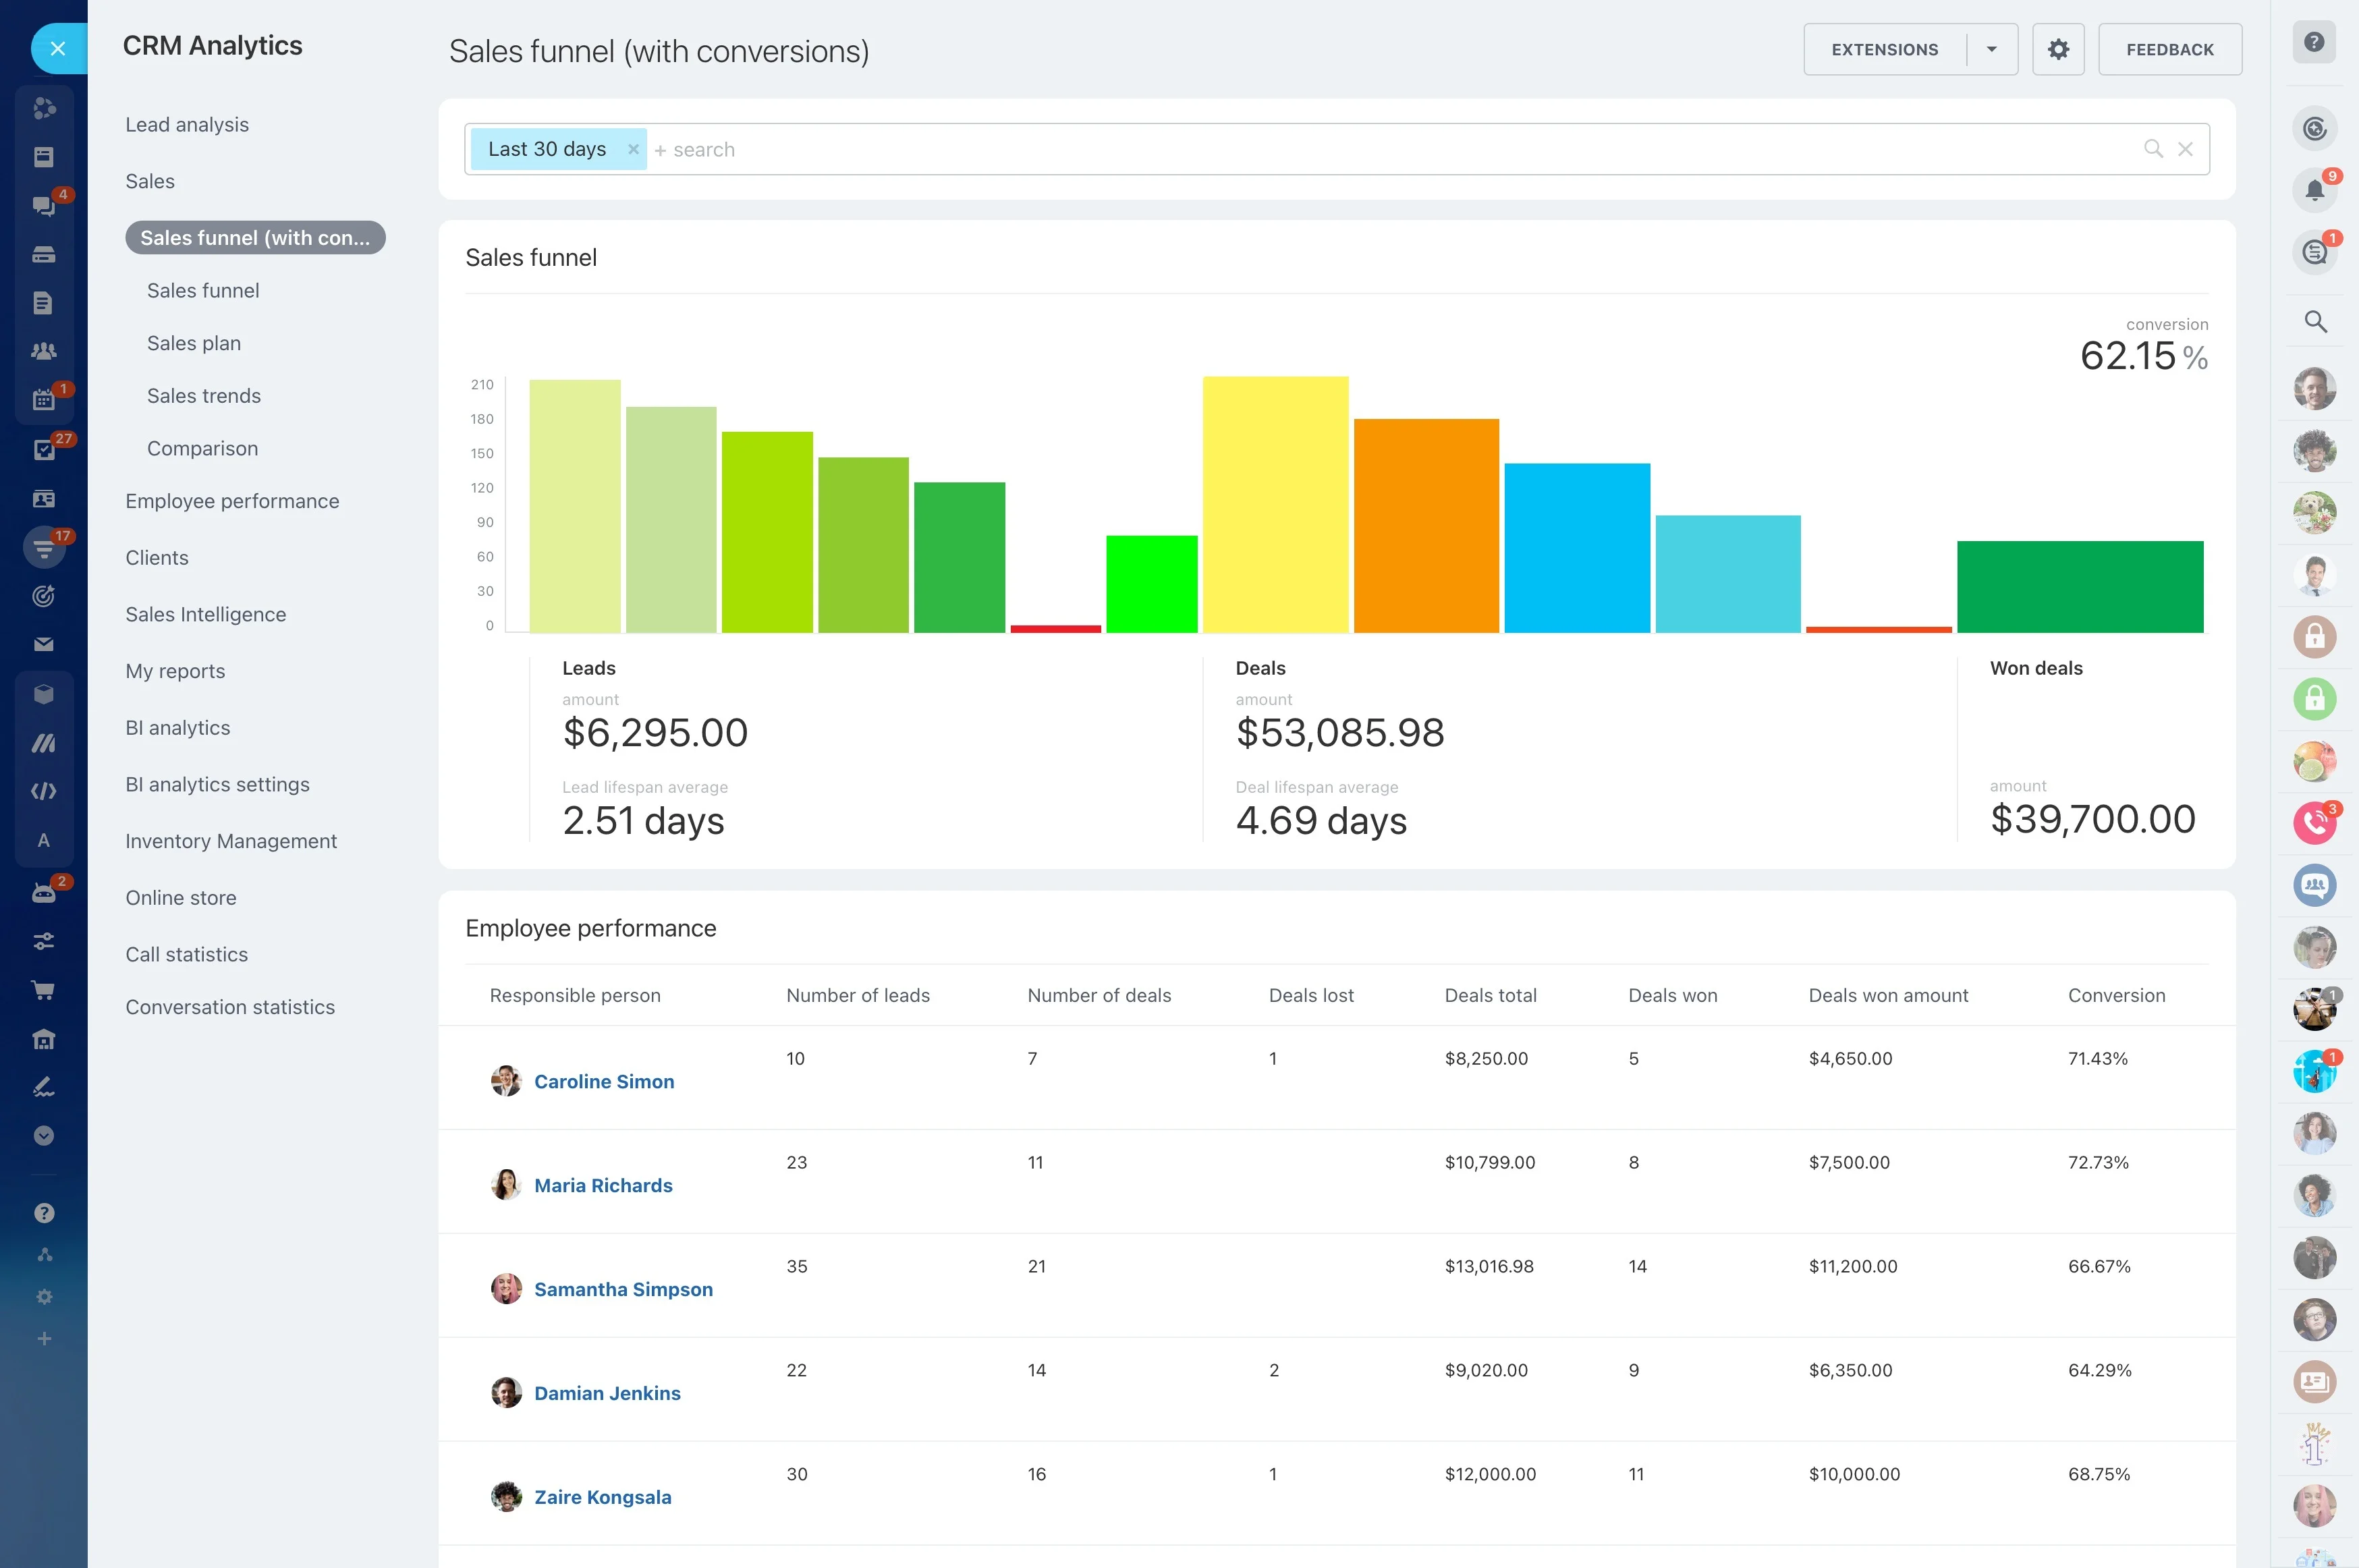
Your Spend, Your Logic
Sales Intelligence shows spend for connected ad accounts natively. For the custom dashboard, the app combines CRM revenue with the spend figures you provide.
- Upload a monthly cost table per channel.
- Include offline channels like events and print.
- Keep the calculation simple and auditable.
AI Commentary That Saves the Meeting
Charts show what happened; commentary explains it. AI only phrases findings the code has already calculated.
- Highlight channels that improved or declined.
- Spot campaigns with leads that never convert.
- Suggest what might be worth testing next.
Build the ROI Dashboard With Vibecode
Describe the KPIs, and AI builds the dashboard. For more ideas, browse AI use cases for Bitrix24.
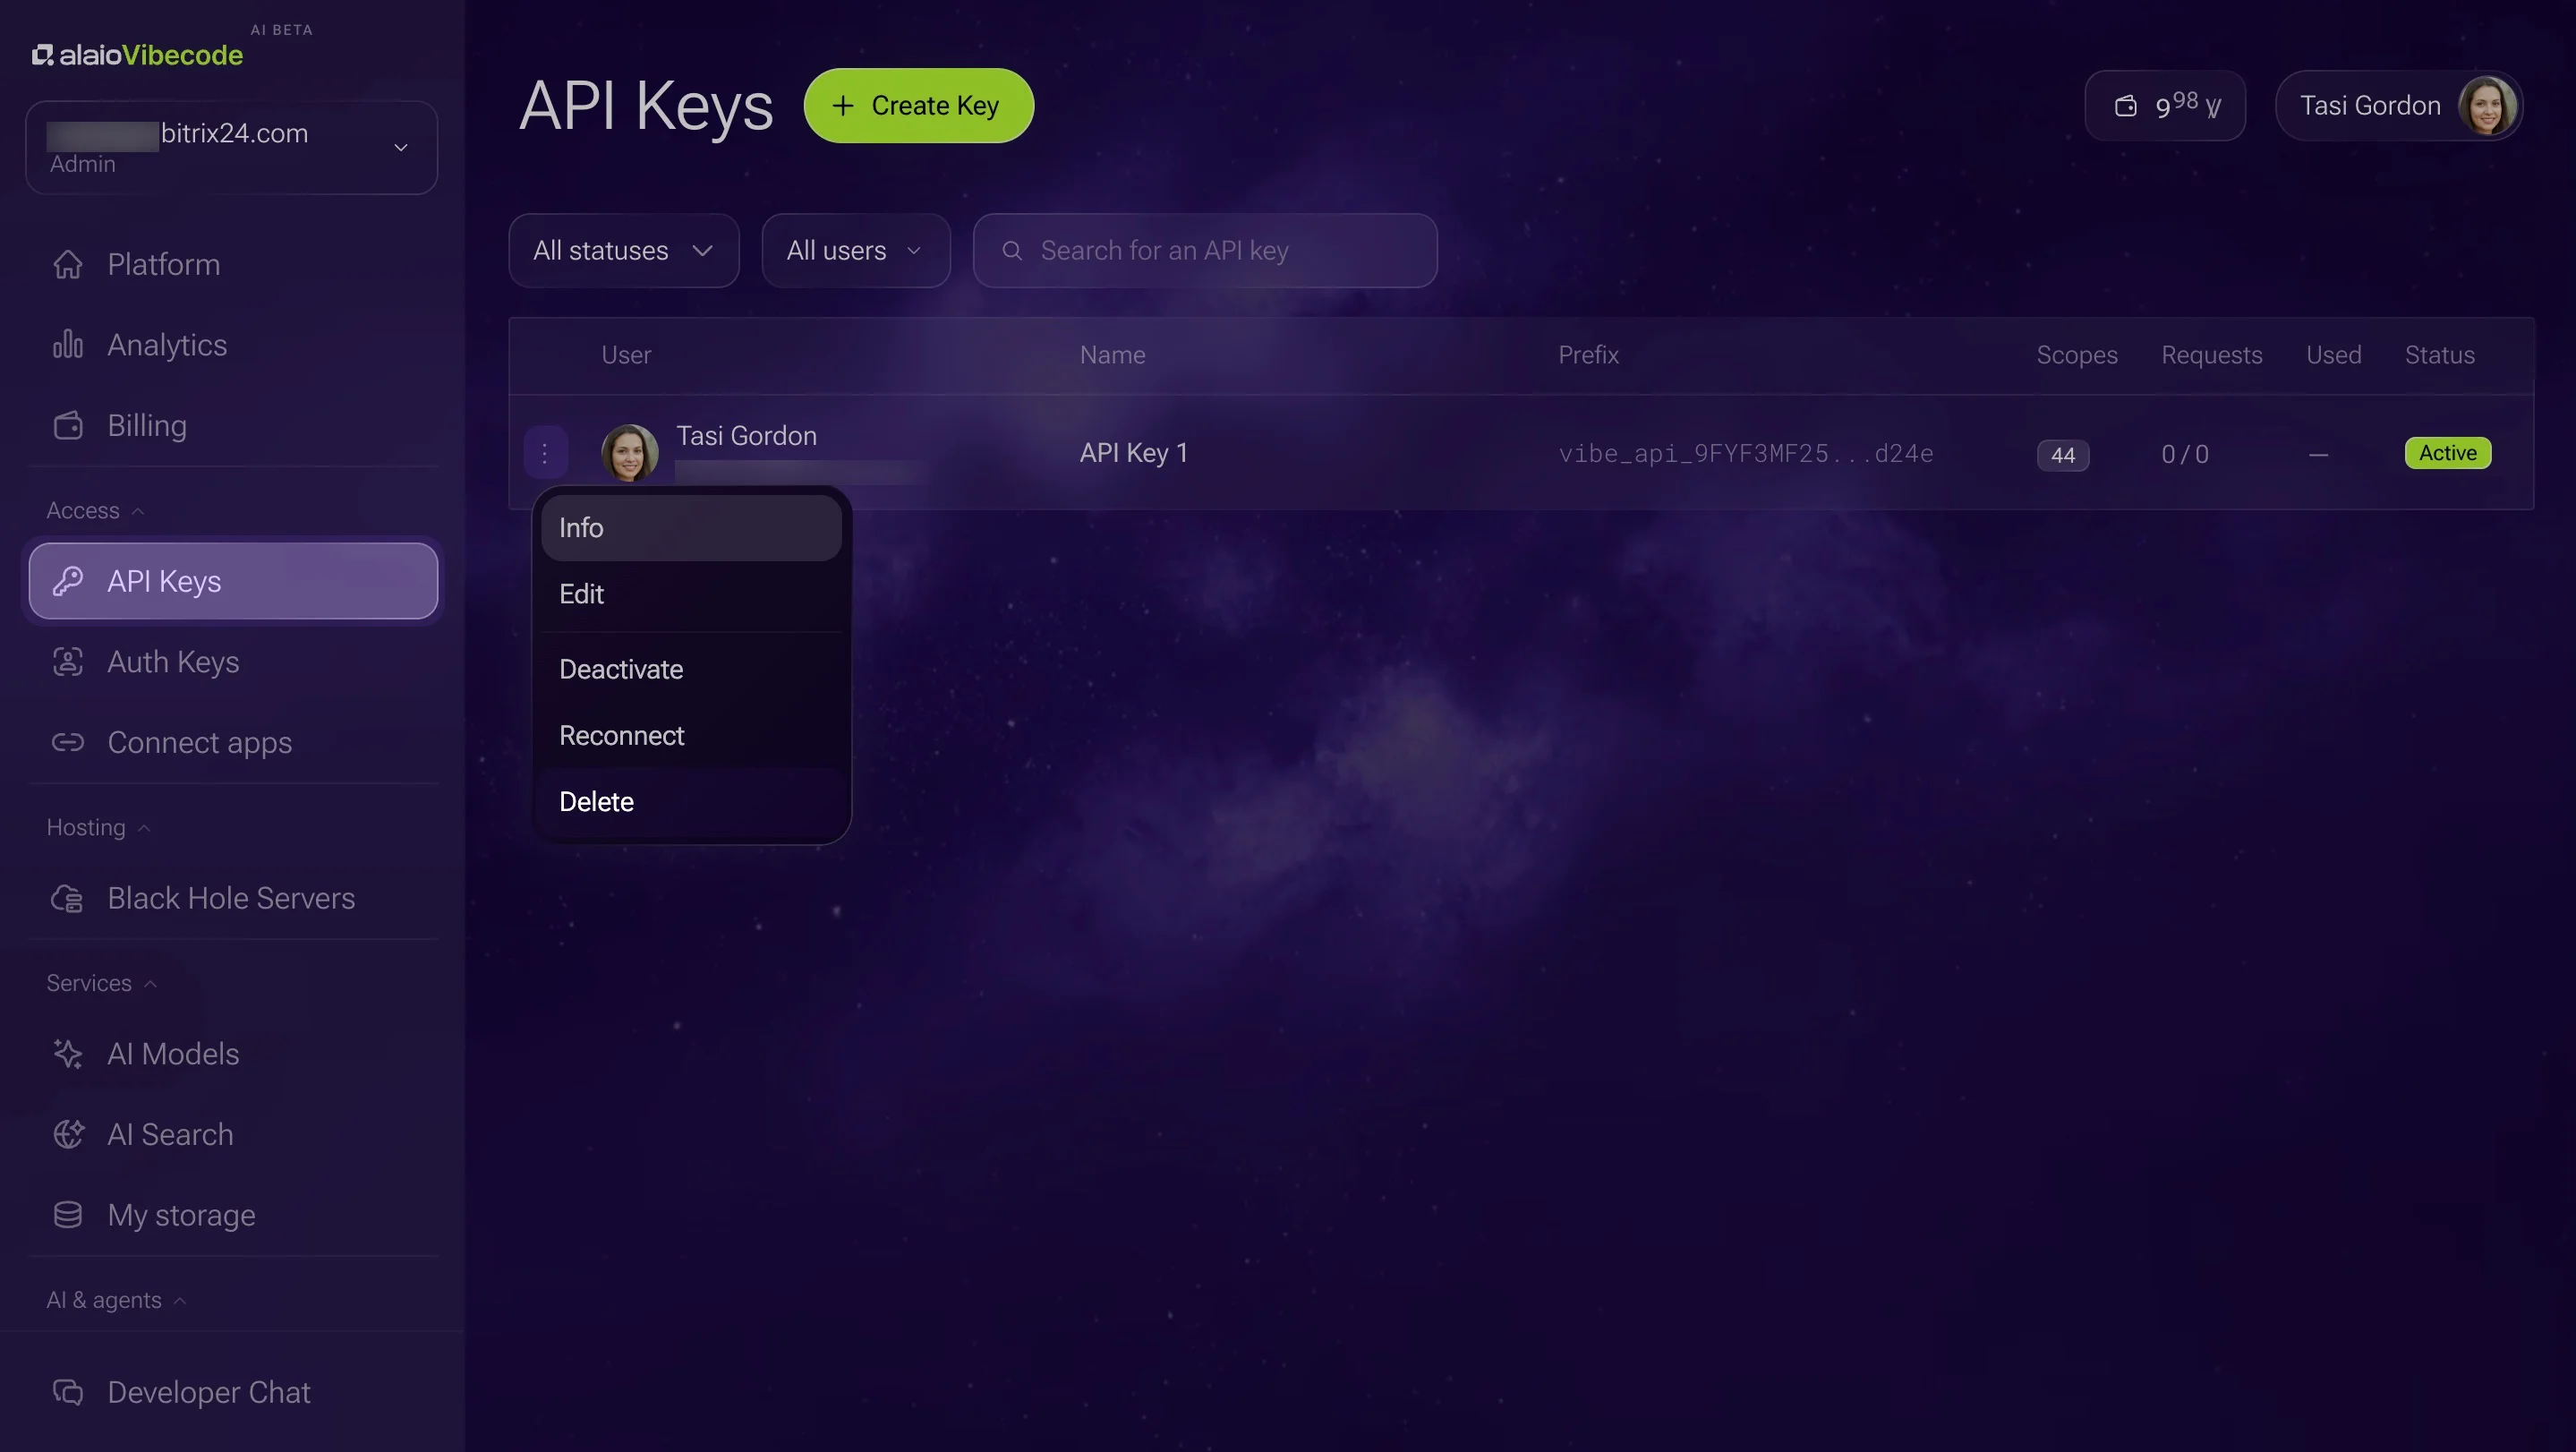
1. Create a read-only API key with CRM access in Vibecode.
2. Describe it: "Show leads, deals, and revenue by source for six months, add cost per channel, and write a weekly summary."
3. Check figures against a month you know well.
4. Refine charts and wording in plain language.
Safe Data, Predictable Costs
Dashboards only read data, so they run with minimal rights.
- A read-only key keeps your CRM untouched.
- Vibe+ plans include the Vibecode API and built-in AI models within your monthly AI allowance.
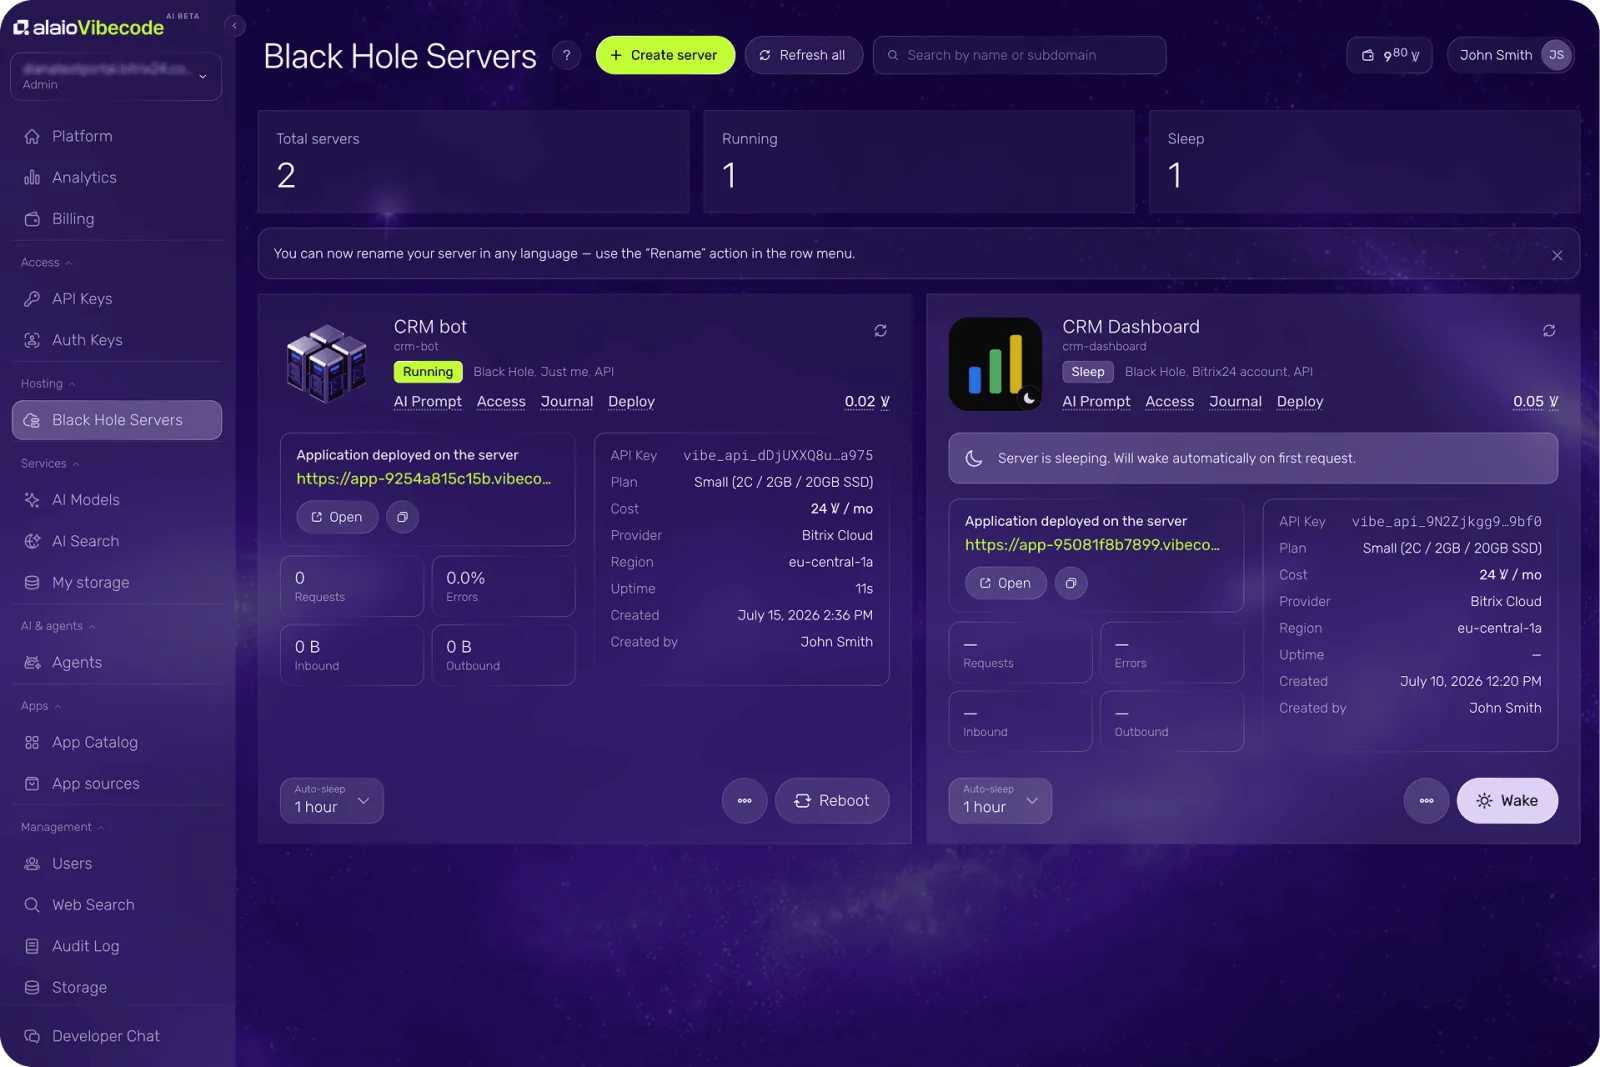
- Hosting is billed in Vibe credits; idle servers sleep at a reduced rate.
- Vibecode is in AI Beta, so plans and pricing may change.
For more information about Bitrix24, head over to our training courses.
We also have a great YouTube channel that covers every aspect of Bitrix24, from sales and planning to document management and company internal communication tools.
To download the self-hosted edition of Bitrix24 that can be installed on your own server and give you access to open source code, please visit the Bitrix24 Self-Hosted page.
Be sure to check out other Bitrix24 tools:
Projects & Operations
15.000.000+ organizations have chosen Bitrix24