
Comparative sales analysis
Compare two products side by side using Bitrix24 deal data
-
Rating
-
Installations84868
-
DeveloperAlaio, inc
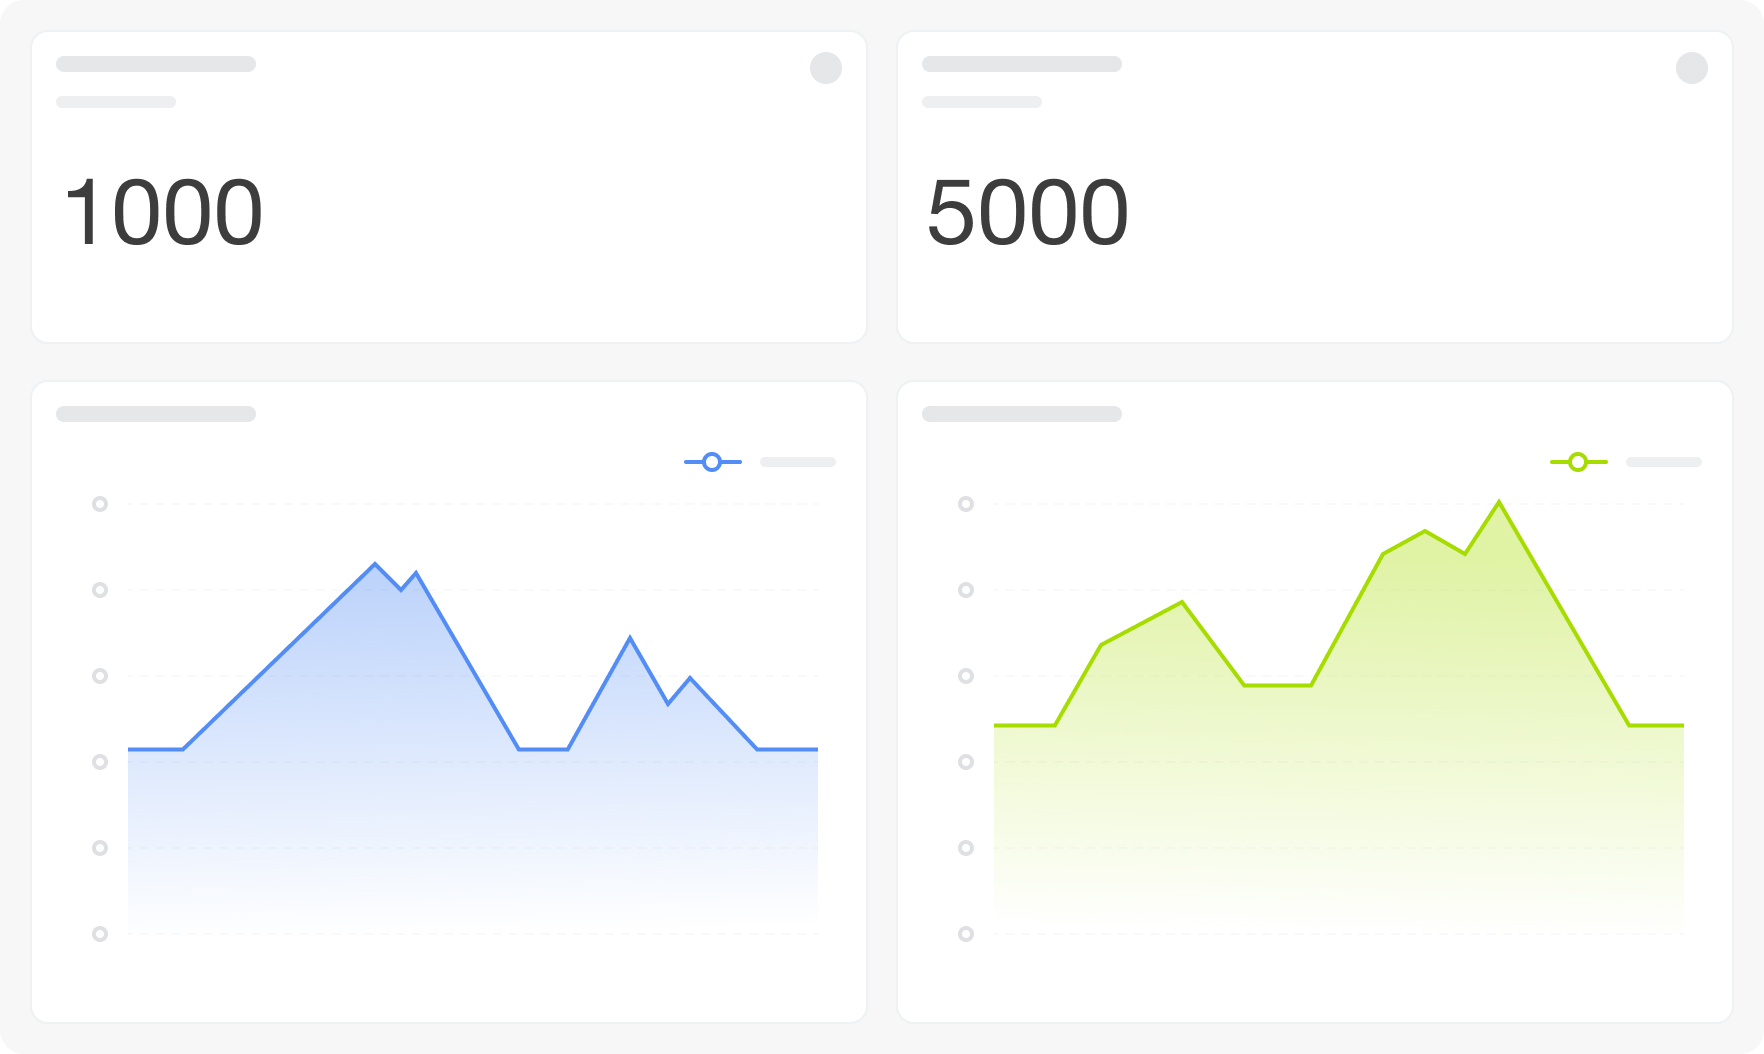
Comparative Product Sales Analytics lets category managers compare any two products (or product groups) directly — revenue, deal count, average price, discount levels, and sales dynamics — on the same screen.
Why businesses use it
Choosing between products, running A/B pricing tests, or justifying assortment decisions requires a direct side-by-side comparison. Single-product reports require manual cross-referencing; this dashboard does the comparison automatically.
Business value
• Compare revenue, deal count, average price, and discount levels for two products
• See a relative difference percentage between products for each key metric
• Track sales dynamics for both products on shared time axes
• Filter by product properties to compare product groups, not just individual SKUs
Common use cases
• Compare two competing SKUs to decide which to prioritize
• Run pricing analysis between a discounted and full-price product version
• Compare product group performance by property and value
• Justify assortment rationalization decisions with side-by-side data
How it works
The dashboard connects to crm_deal_product_row. Twenty visualizations are arranged in a Product 1 vs. Product 2 structure: individual KPI cards for both products (deals, revenue, average price, average discount, discount size), shared line charts for sales dynamics, average units sold, discount size, and average discount, plus "Difference %" KPI cards for each metric. Filters: Period, Grouping, Pipeline, Product 1, Product property 1, Property value 1, Product 2, Product property 2, Property value 2.
FAQ
We have two similar products and want to know which one is actually performing better — not just by gut feel. How do we compare them?
Select both products using the Product 1 and Product 2 filters. The dashboard shows revenue, deal count, average price, and discount levels for each side, plus a "Difference %" card for each metric so the gap is quantified.
We ran a pricing change on one product and want to measure its impact against a stable reference product. Is that possible?
Yes — set the changed product as Product 1 and the reference as Product 2. The shared line charts show both products on the same time axis so the divergence after the pricing change is directly visible.
We want to compare not specific SKUs but whole product groups by a shared attribute. Can we do that?
Yes — use the "Product property" and "Property value" filters instead of selecting individual items. This lets you compare segments of the catalog rather than single products.
What is needed to connect to Bitrix24?
Access credentials for the Bitrix24 BI connector, configured during app installation.

Version history
Version 3
Version 2


