
Deals and products
Analyze product sales by category, pricing, and discounts in Bitrix24
Free
-
Rating
-
Installations93979
-
DeveloperAlaio, inc
Description
Deal Product Analytics gives commercial managers and category teams visibility into what is actually selling — by category, price dynamics, discount patterns, and average deal composition — directly fr om Bitrix24 deal product rows.
Why businesses use it
Understanding product sales requires more than deal totals. Category managers need to see which product groups drive revenue, how discounts are distributed, how prices are changing, and how many items appear in a typical deal.
Business value
• Analyze revenue by product category and subcategory hierarchy
• Track discount rate, discount volume, and deals-with-discount share
• Monitor price change distribution and identify price drift
• See average deal size and item count per deal over time
Common use cases
• Identify which product categories are growing or declining in revenue share
• Review discount levels by product and identify wh ere discounts are excessive
• Track price changes compared to catalog prices across products
• Analyze average deal composition and item count trends
How it works
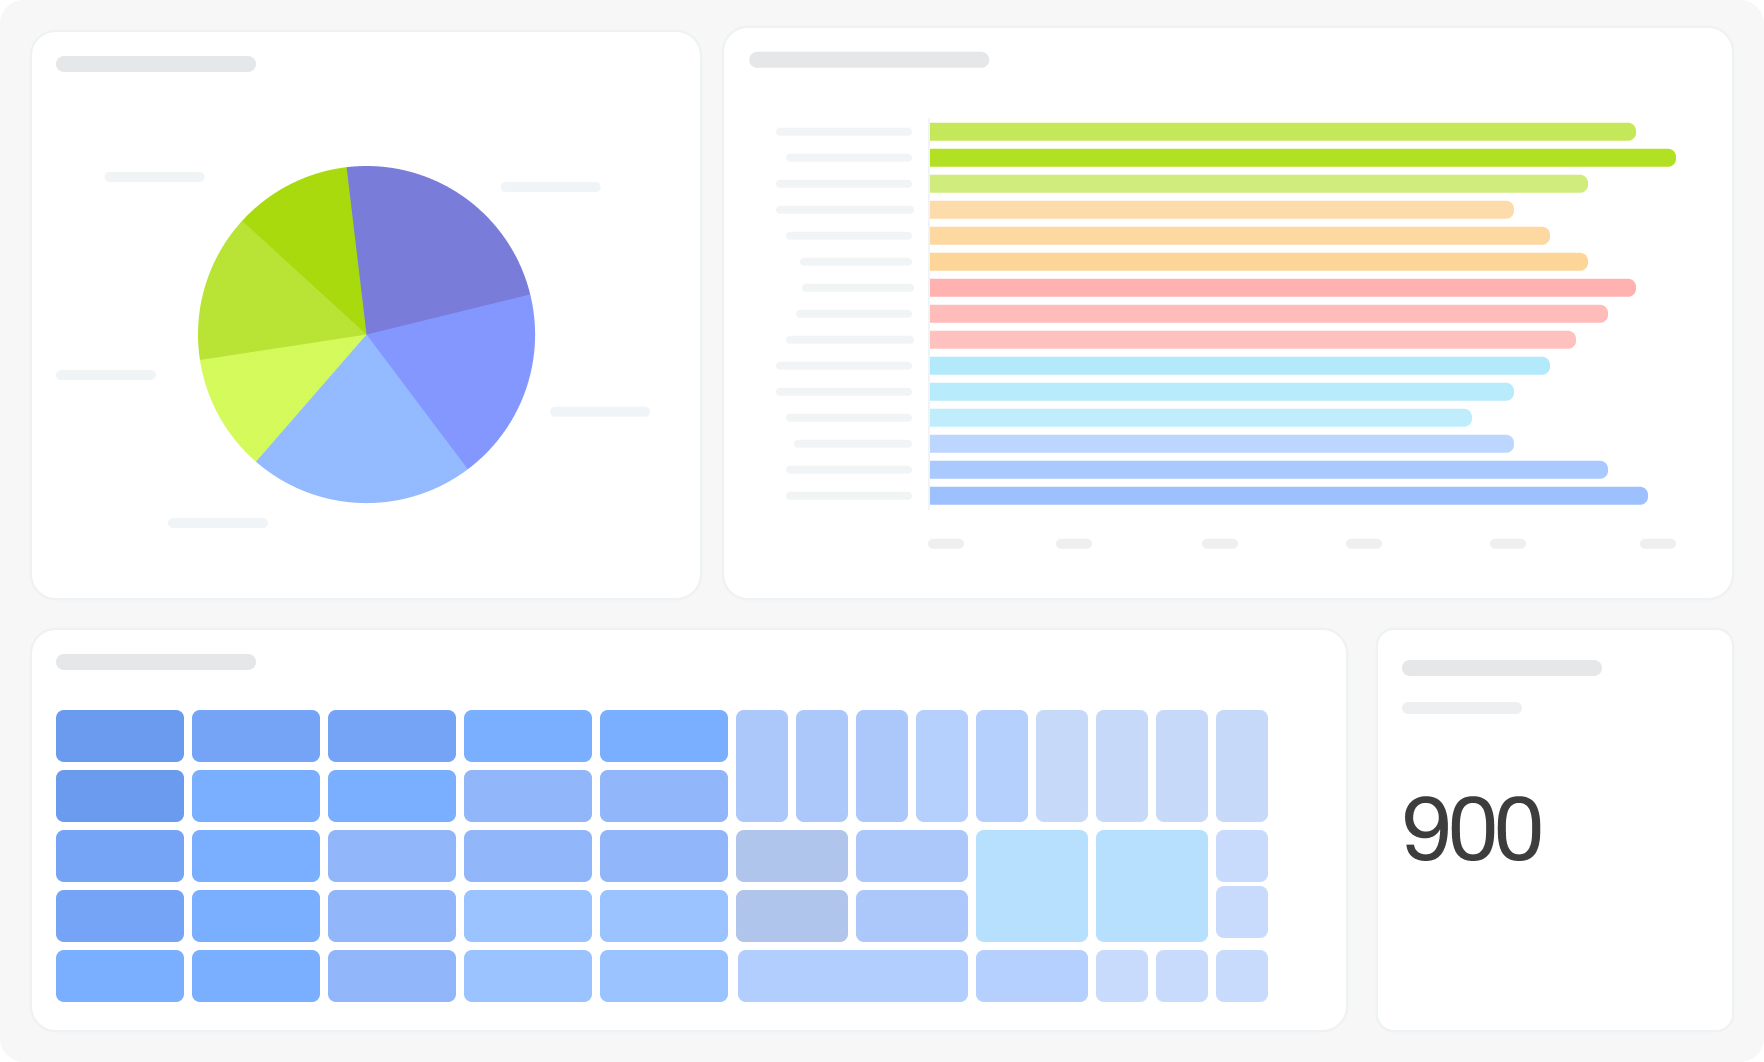
The dashboard connects to crm_deal_product_row and the Bitrix24 product catalog hierarchy. Nineteen visualizations cover KPI cards (average discount, deals with discounts share, total discount amount, unique products sold), revenue dynamics, deal count, product volume, items per deal, discounted revenue, category pie chart, subcategory bar chart and treemap, price change distribution, price increase/decrease rankings, and product revenue table. Filters: Period, Pipeline, Category, Subcategory Level 1, Subcategory Level 2.
FAQ
We sell across many product categories but don't know which ones are actually driving revenue. How does this show it?
The category pie chart, subcategory bar charts, and treemap break revenue down by the full catalog hierarchy — fr om top-level category to subcategory level 2. You can see exactly wh ere revenue is concentrated.
Discounts seem to be applied inconsistently across the team, but we have no visibility into it. Can we track that here?
Yes — the discount KPI cards, deals-with-discounts share, and the product discount ranking table show where discounts are largest and most frequent. Use it to identify outliers.
Our actual selling prices don't always match catalog prices but we have no way to track the drift. Is there a metric for that?
The price change distribution chart groups products by how their deal price compares to the catalog base price — showing which items are being sold above, at, or below catalog.
What is needed to connect to Bitrix24?
Access credentials for the Bitrix24 BI connector, configured during app installation.
Why businesses use it
Understanding product sales requires more than deal totals. Category managers need to see which product groups drive revenue, how discounts are distributed, how prices are changing, and how many items appear in a typical deal.
Business value
• Analyze revenue by product category and subcategory hierarchy
• Track discount rate, discount volume, and deals-with-discount share
• Monitor price change distribution and identify price drift
• See average deal size and item count per deal over time
Common use cases
• Identify which product categories are growing or declining in revenue share
• Review discount levels by product and identify wh ere discounts are excessive
• Track price changes compared to catalog prices across products
• Analyze average deal composition and item count trends
How it works
The dashboard connects to crm_deal_product_row and the Bitrix24 product catalog hierarchy. Nineteen visualizations cover KPI cards (average discount, deals with discounts share, total discount amount, unique products sold), revenue dynamics, deal count, product volume, items per deal, discounted revenue, category pie chart, subcategory bar chart and treemap, price change distribution, price increase/decrease rankings, and product revenue table. Filters: Period, Pipeline, Category, Subcategory Level 1, Subcategory Level 2.
FAQ
We sell across many product categories but don't know which ones are actually driving revenue. How does this show it?
The category pie chart, subcategory bar charts, and treemap break revenue down by the full catalog hierarchy — fr om top-level category to subcategory level 2. You can see exactly wh ere revenue is concentrated.
Discounts seem to be applied inconsistently across the team, but we have no visibility into it. Can we track that here?
Yes — the discount KPI cards, deals-with-discounts share, and the product discount ranking table show where discounts are largest and most frequent. Use it to identify outliers.
Our actual selling prices don't always match catalog prices but we have no way to track the drift. Is there a metric for that?
The price change distribution chart groups products by how their deal price compares to the catalog base price — showing which items are being sold above, at, or below catalog.
What is needed to connect to Bitrix24?
Access credentials for the Bitrix24 BI connector, configured during app installation.

Version history
Version 3
bug fixes
26.06.2026
Version 2
bug fixes
09.12.2025


