
Employee performance inside CRM
Assess employee CRM activity and deal performance in Bitrix24
Free
-
Rating
-
Installations6918
-
DeveloperAlaio, inc
Description
Total Employee Efficiency with CRM gives managers a complete view of how an employee works within CRM — activity volume on deals and leads, first contact speed, conversion rates, deal and lead close times, pipeline share, and revenue results. It is built for sales managers who need a single view of CRM-based employee performance.
Why businesses use it
Evaluating a sales employee requires more than looking at closed deals. Managers need to see how actively an employee engages with leads and deals through CRM activities, how quickly they make first contact, and where their pipeline stands — all in one place.
Business value
• See CRM activity volume per employee across deals and leads
• Track the share of deals and leads with at least one logged activity
• Measure first contact time for deals and leads
• Review deal and lead close times, pipeline volume, and revenue
• Identify top companies and contacts by activity
Common use cases
• Evaluate how actively an employee works their deal and lead pipeline
• Compare first contact speed across employees
• Identify deals or leads with no CRM activity logged
• Review funnel comparison and deal failure reasons per employee
How it works
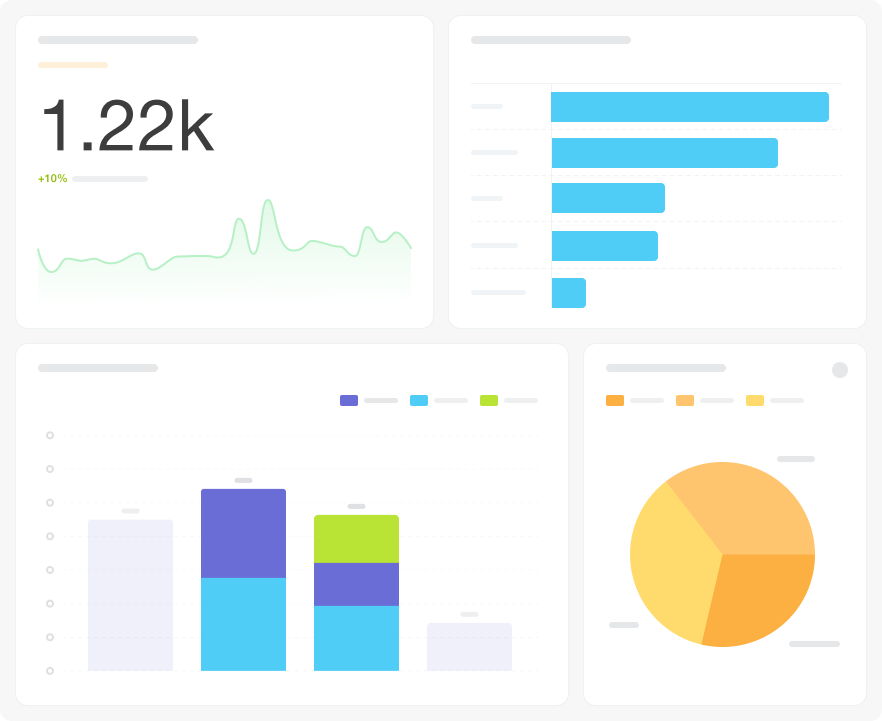
The dashboard connects to CRM activity, deal, and lead data. Thirty-nine visualizations cover: CRM activity counts for deals and leads, activity share percentages, activities per deal/lead averages, total interactions KPI, activity dynamics charts, first contact time for deals and leads, deals and leads in progress, deals and leads without activities, deal failure reasons pie, employee pipeline share, funnel comparison table, top-10 companies and contacts, revenue KPI, successful deals count, and total deal and lead counts. Filters: Period, Grouping, Pipeline.
FAQ
We want to evaluate our sales reps not just by closed deals but by how actively they work their pipeline. Is that possible here?
Yes — the dashboard tracks CRM activities per deal and per lead, the share of deals and leads that have at least one activity logged, and how quickly the employee makes first contact. It shows work quality, not just outcomes.
Some reps close deals but rarely log activities in CRM, making it hard to coach them. How do we identify that pattern?
The "deals without activities" and "leads without activities" KPIs show exactly how many pipeline records have no logged interactions. A high number here signals a CRM compliance issue alongside the revenue data.
We promoted someone based on deal count but their pipeline quality looks shaky. How do we assess that more rigorously?
Look at first contact time, activity per deal/lead averages, and the deal failure reason pie alongside revenue. A rep who closes deals but has high first-contact lag and low activity density may be working a lucky pipeline, not a disciplined one.
What is needed to connect to Bitrix24?
Access credentials for the Bitrix24 BI connector, configured during app installation.
Why businesses use it
Evaluating a sales employee requires more than looking at closed deals. Managers need to see how actively an employee engages with leads and deals through CRM activities, how quickly they make first contact, and where their pipeline stands — all in one place.
Business value
• See CRM activity volume per employee across deals and leads
• Track the share of deals and leads with at least one logged activity
• Measure first contact time for deals and leads
• Review deal and lead close times, pipeline volume, and revenue
• Identify top companies and contacts by activity
Common use cases
• Evaluate how actively an employee works their deal and lead pipeline
• Compare first contact speed across employees
• Identify deals or leads with no CRM activity logged
• Review funnel comparison and deal failure reasons per employee
How it works
The dashboard connects to CRM activity, deal, and lead data. Thirty-nine visualizations cover: CRM activity counts for deals and leads, activity share percentages, activities per deal/lead averages, total interactions KPI, activity dynamics charts, first contact time for deals and leads, deals and leads in progress, deals and leads without activities, deal failure reasons pie, employee pipeline share, funnel comparison table, top-10 companies and contacts, revenue KPI, successful deals count, and total deal and lead counts. Filters: Period, Grouping, Pipeline.
FAQ
We want to evaluate our sales reps not just by closed deals but by how actively they work their pipeline. Is that possible here?
Yes — the dashboard tracks CRM activities per deal and per lead, the share of deals and leads that have at least one activity logged, and how quickly the employee makes first contact. It shows work quality, not just outcomes.
Some reps close deals but rarely log activities in CRM, making it hard to coach them. How do we identify that pattern?
The "deals without activities" and "leads without activities" KPIs show exactly how many pipeline records have no logged interactions. A high number here signals a CRM compliance issue alongside the revenue data.
We promoted someone based on deal count but their pipeline quality looks shaky. How do we assess that more rigorously?
Look at first contact time, activity per deal/lead averages, and the deal failure reason pie alongside revenue. A rep who closes deals but has high first-contact lag and low activity density may be working a lucky pipeline, not a disciplined one.
What is needed to connect to Bitrix24?
Access credentials for the Bitrix24 BI connector, configured during app installation.

Version history
Version 4
bug fixes
03.07.2026
Version 3
bug fixes
15.12.2025
Version 2
bug fixes
12.10.2025


